
Csaba Müller
Business & Data Analyst | BI Developer
About Me
I am a results-oriented professional more than 10 years experiences in multinational environments (automotive and medical technology), now dedicated to advancing my career in data analysis, data engineering and business intelligence.I’m focused on creating business insights that drive decision making, and I help companies automate reports that connect to all their data.
Skills

Excel | Power BI | SQL | Python
Projects
POWER BI | Power Query | DAX | Data Cleaning & Data Modelling
Human Resource Department – Employee Attrition Analysis
In today's competitive job market, understanding the drivers behind employee turnover is crucial for maintaining organizational stability. This project moves beyond raw data to provide a clear, visual narrative of the workforce, enabling HR professionals to identify high-risk areas and implement data-driven retention strategies.

Power BI | Power Query | Data Cleaning
Analyzing Data Professional Survey
The project draws on the results of a survey conducted among data management professionals. The process involves data import, data cleaning (Power Query), visualization, and data analysis.
SQL | DataLab Notebook
Analyzing Students' Mental Health
Analyzed a dataset from a Japanese international university to investigate the impact of studying abroad on students' mental health. The goal was to validate findings from a 2018 study regarding the risks of depression among international students.

Professional Certifications


Contact
© Csaba Müller. All rights reserved.
Analyzing Students' Mental Health (SQL Project)
Project Overview
In this project, I analyzed a dataset from a Japanese international university to understand how the length of stay impacts the mental health of international students. The study focused on depression (PHQ-9), social connectedness (SCS), and acculturative stress (ASISS).This project was completed as part of a DataCamp certification.
Project Goal
To analyze whether the length of stay in a foreign country impacts the mental health of international students. The study focused on depression (PHQ-9), social connectedness (SCS), and acculturative stress (ASISS).
Files in the GitHub repository-->
notebook.ipynb: The SQL code containing the analysis
result_image.png: A snapshot of the query results
students.csv: Raw data source
mentalhealth.jpg: Cover picture of the project
Studentsdatasql_SELECT.png: All SELECT query results
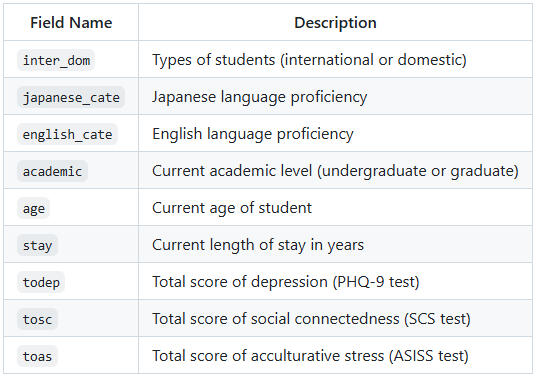
Description of the columns of "students.csv" you may find helpful
Tools & Skills
Language: SQL (PostgreSQL)
Techniques: Data Filtering (WHERE), Aggregation (AVG, COUNT), Grouping (GROUP BY), Ordering (ORDER BY), Data rounding (ROUND).
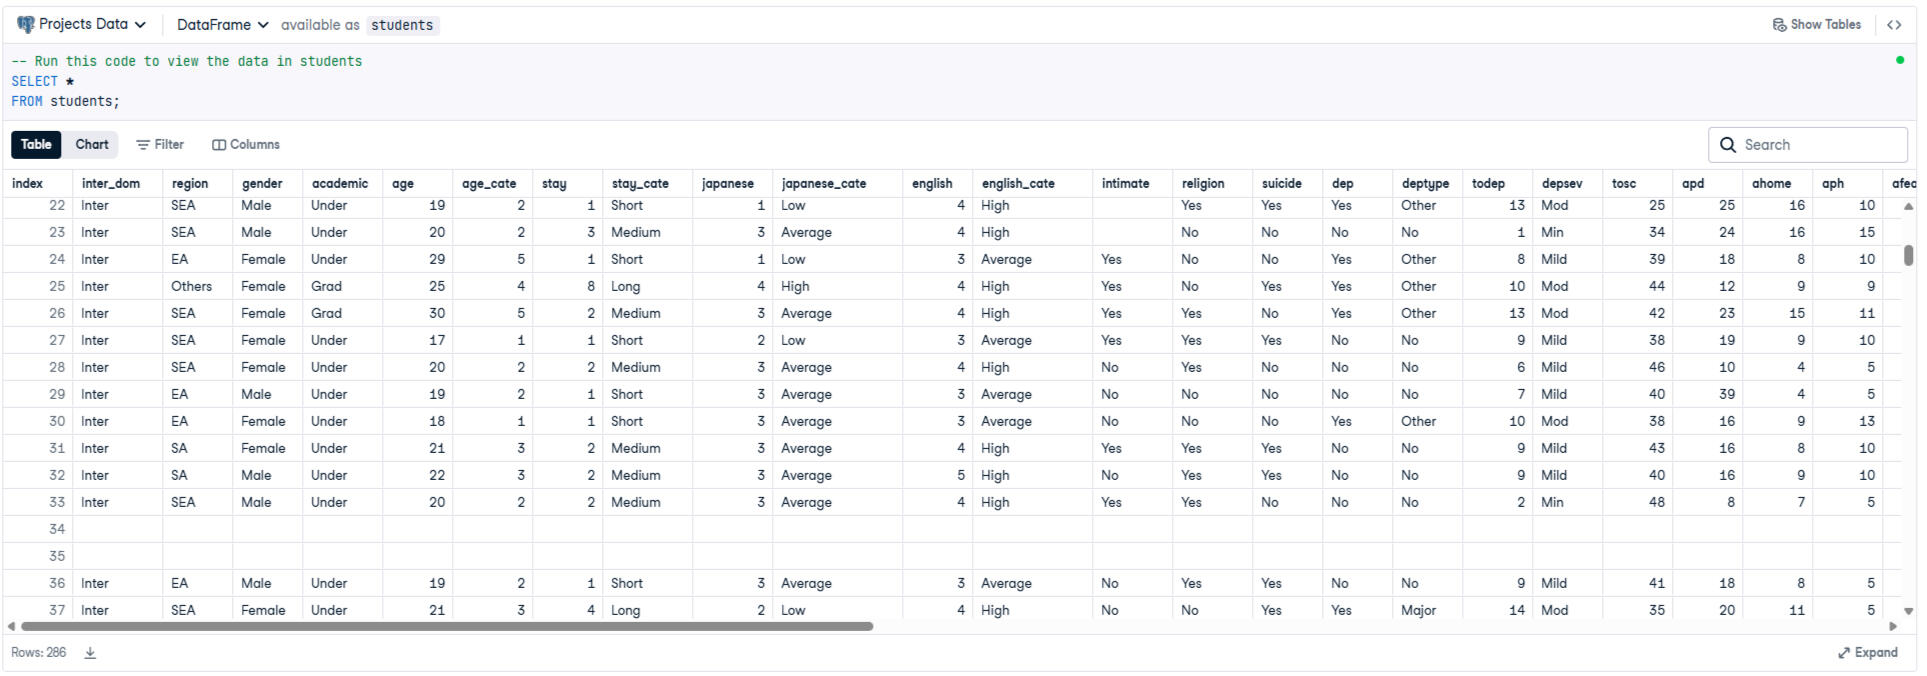
Query "all" results in students table
Key Findings
After filtering for international students (inter_dom = 'Inter') and grouping by the length of stay, the analysis revealed:
1.) Depression Score (PHQ-9): The average depression score varies depending on how long the student has been in the country.
2.) Stress Levels (ASISS): Acculturative stress shows distinct patterns across different lengths of stay.
The following SQL query was used to aggregate and filtering the data:
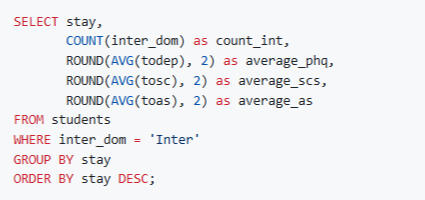
Results
The analysis reveals how mental health metrics fluctuate for international students depending on their duration of stay. The SQL query returned the following aggregated data:

Conclusion
Confirmed that international students face higher risks of mental health difficulties linked to social connectedness.
Crucial Insight
Upon analyzing the "stay", I identified a sample size issue with durations exceeding 5 years. I concluded that only the 1-4 year range provides statistically significant data, as the low sample count for other durations would distort the correlation analysis regarding depression scores.
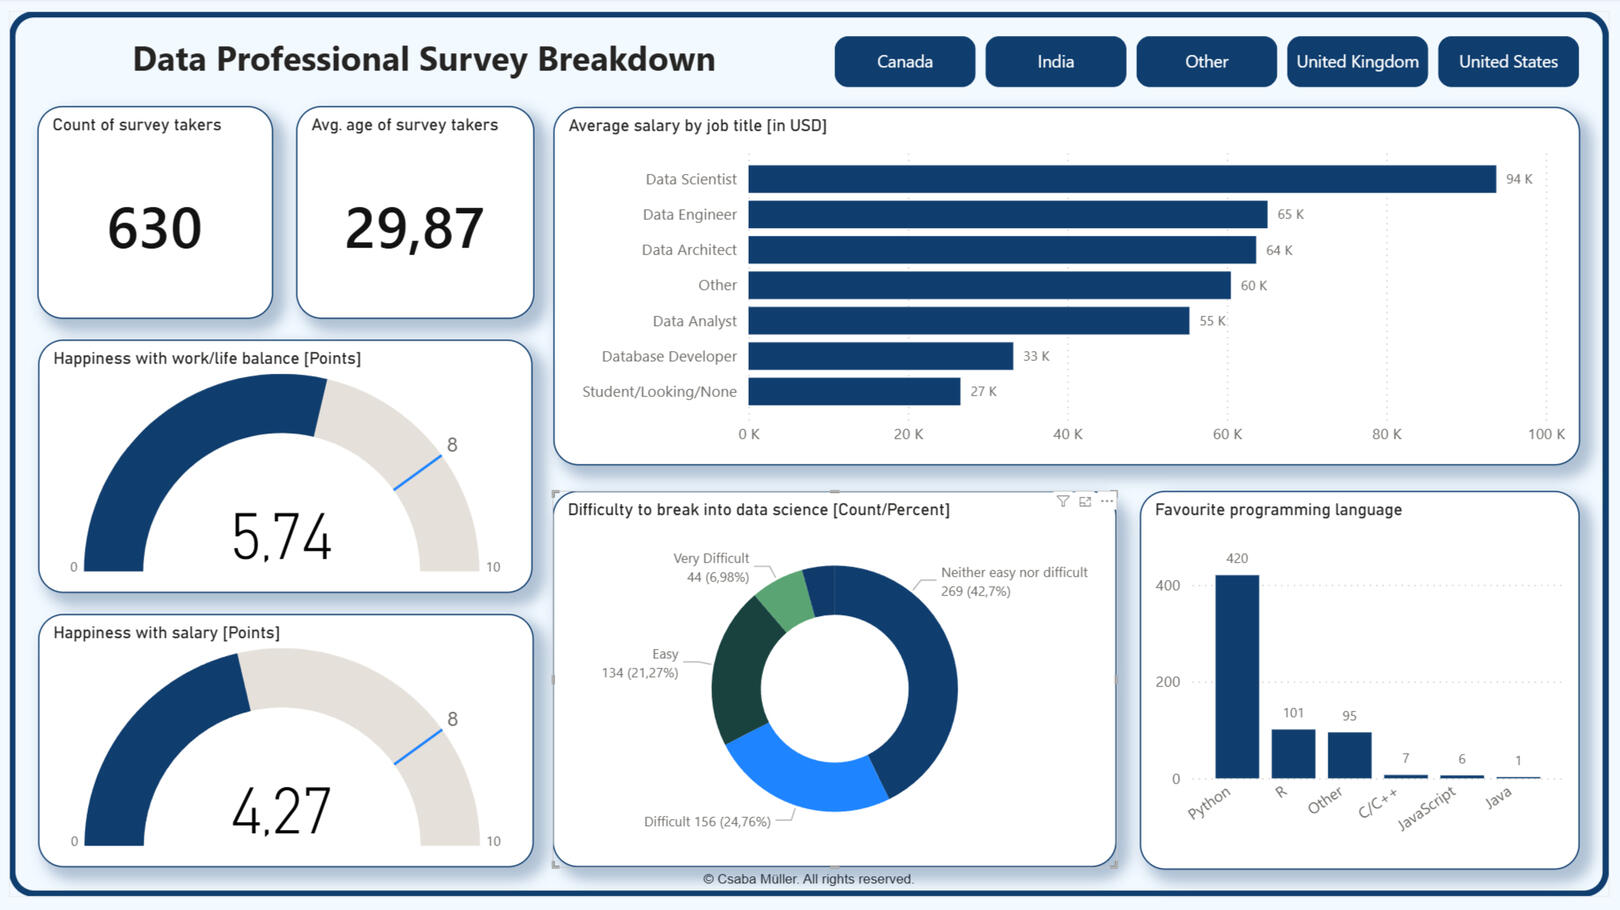
Analyzing a data professional survey
Project Overview
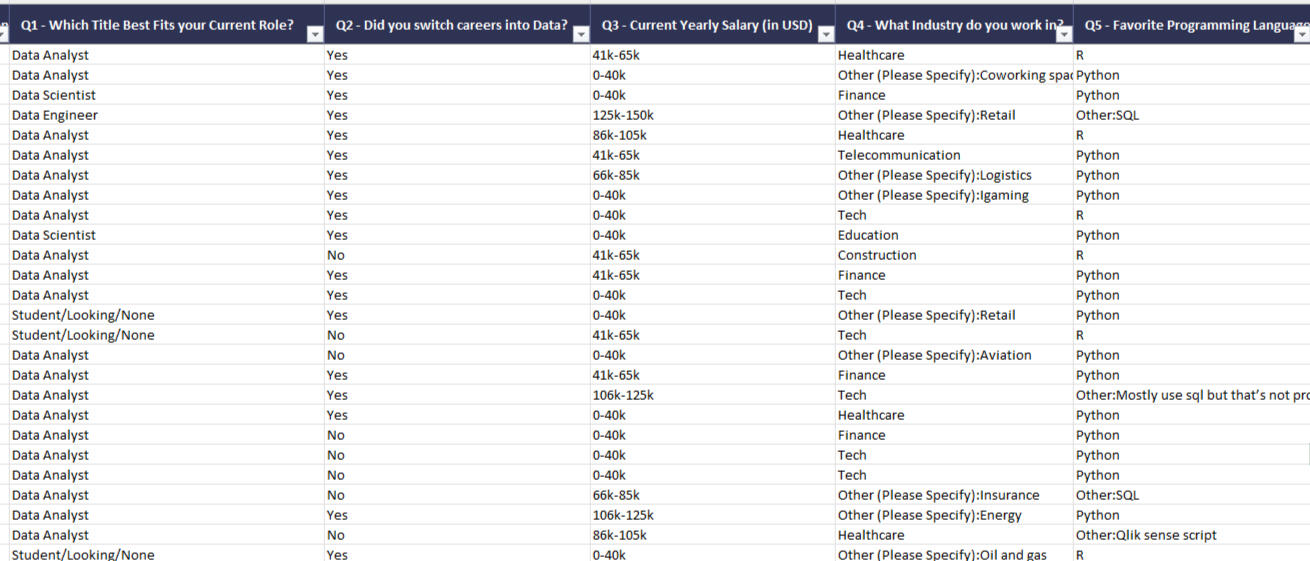
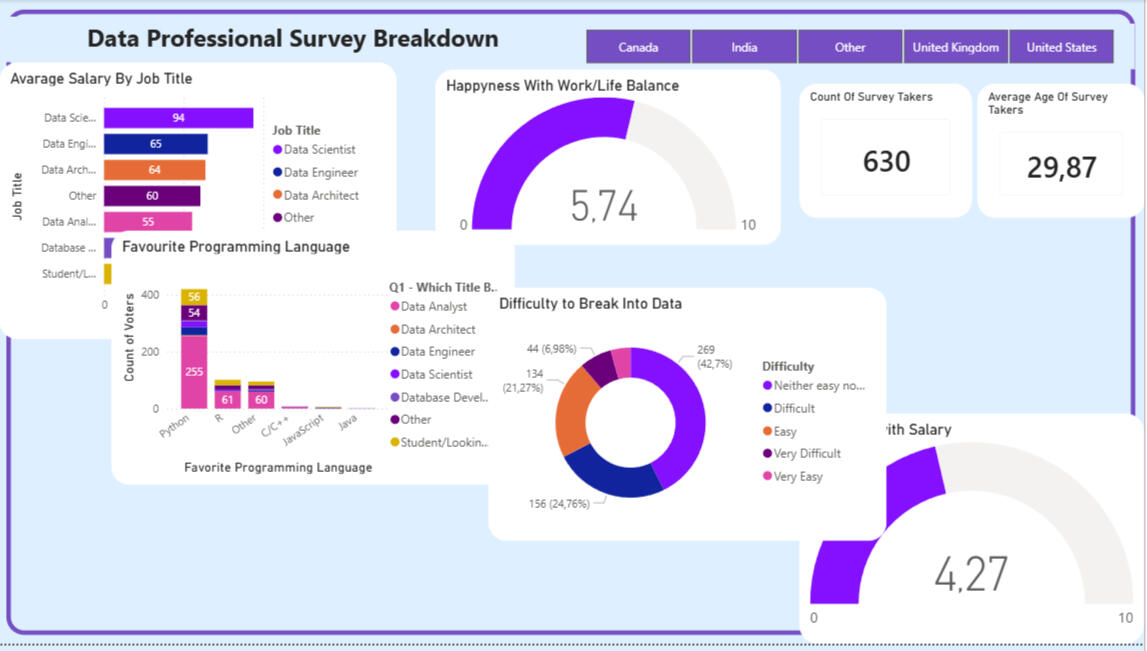
The dataset results from a real survey completed by approximately 600–700 data professionals. It includes job titles, salaries, favorite programming languages, work-life balance, and demographic data.
Project Goal
The goal of the project is data import, cleaning (Power Query), visualization, making a dashboard and data analysis. The raw data is provided in Excel (It can be found on the GitHub), but I intentionally performed the data cleaning within Power BI.
The following questioned must have been answered:
1. What are the avarage salaries by job title?
2. What are the favorite programming languages among data professionals?
3. How difficult is it to break into the data science?
4. How happy are you in your current position with the following? (Work/Life Balance)
5. How happy are you in your current position with the following? (Salary)
Files in the GitHub repository-->
Tools & Skills
Tools: Power Query, Microsoft Power BI
Techniques: raw data import, data cleaning, data visualization, business insight
Data Cleaning and Transformation (Power Query)
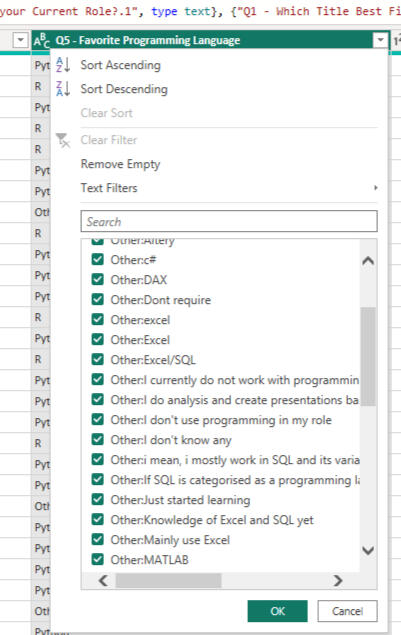
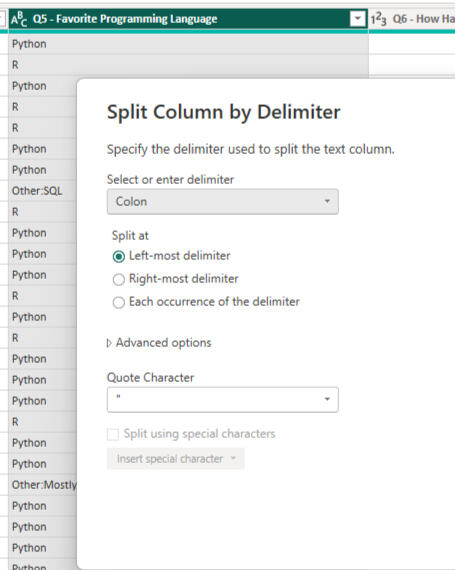
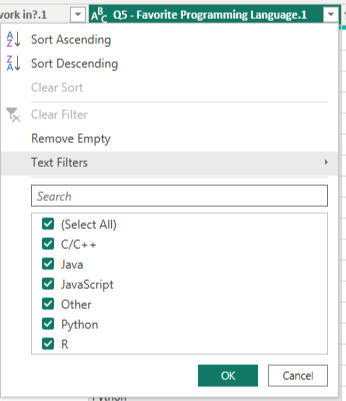
1. I deleted columns not needed for the analysis. (e.g., browser type, email).
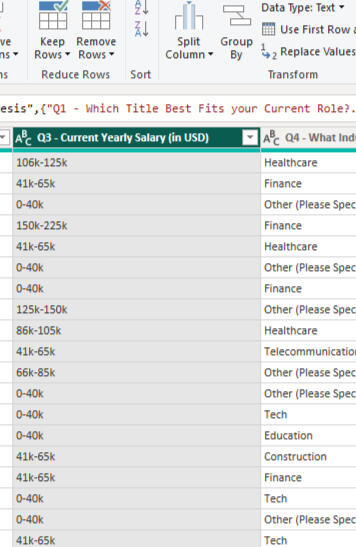
2. I standardized the text data in the required columns. For example ther the "Job Title" and "Programming Language" columns, I used the "Split Column" function based on delimiters (e.g., parentheses, colons) to obtain manageable categories:
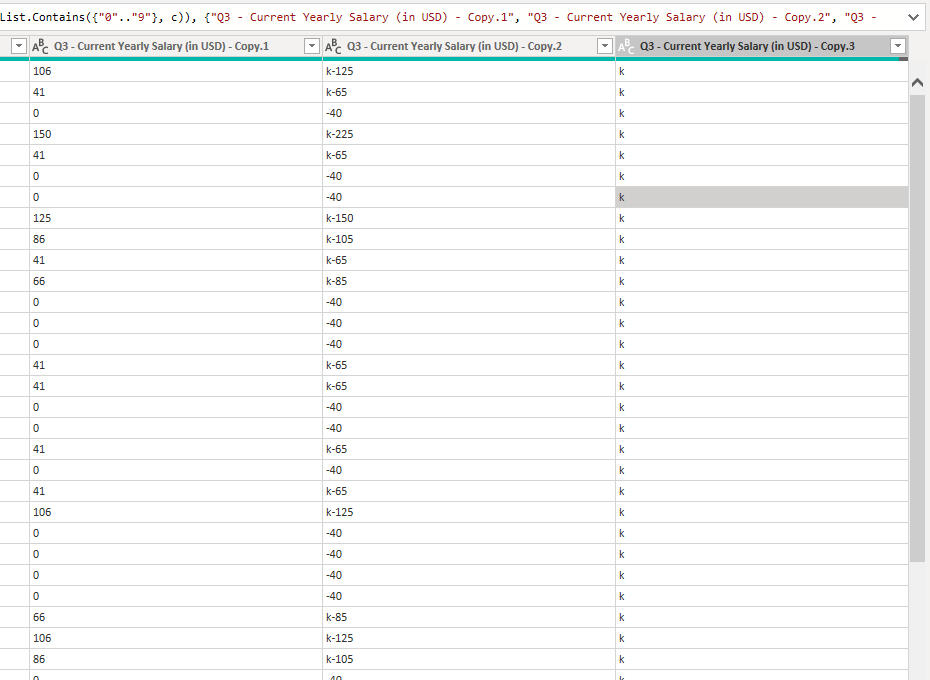
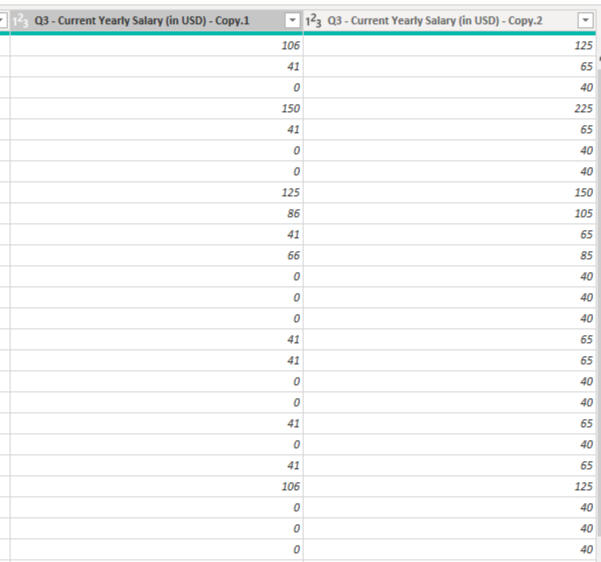
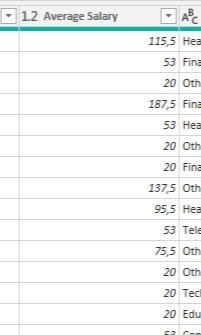
3. I converted the salary data. This was the most complex part. I filtered out non-numeric characters from the text ranges (e.g., "100k-120k"), then created a "Custom Column", that calculates the average of the ranges, allowing me to work with them as numerical values in the charts:

The section mentioned above is just a small part of the data cleaning work that was done. If you’d like more details, please download the Power BI file uploaded to GitHub.
Creating Visualizations
Cards: For quick access to key metrics, such as the total number of respondents and the average age.
Clustered Bar Chart: To visualize average salaries by job role.
Clustered Column Chart: The popularity of favorite programming languages (Python leads by a wide margin).
Slicer: For filtering respondents by country. Clicking on a country updates all other charts to reflect that region.
Gauge: Measuring professional satisfactions (salary and work-life balance) on a scale from 0 to 10.
Donut Chart: Visualizing the difficulty of career advancement by level of difficulty.
Design and Layout (Finishing the Dashboard)
I placed the Cards and Gauges on the left side of the dashboard. The project name and button slicer were placed in the "Header" section. I placed the various column, bar, and donut charts in the center and on the right side.

Conclusion
Salaries: Data Scientists earn the highest average ($94K ), while Data Analysts start around $55K .
Tools: Python is the dominant industry standard (420 votes), far outpacing R and others.
Entry: Breaking into the field is perceived as moderately challenging 42.7%, neutral difficulty.
Sentiment: Professionals are moderately happy with their work-life balance (5.74/10), but significantly less satisfied with their compensation (4.27/10).
HR Analytics Dashboard – Employee Attrition Analysis
Project Overview
In this project, I developed a comprehensive HR analytics solution to uncover the underlying causes of employee turnover. Starting from a raw dataset (Excel), I built an interactive Power BI dashboard through data cleaning and modeling to effectively support HR management in their decision-making process.
Project Goals
My primary goal was to identify which employee segments are most at risk of leaving and to determine which factors (e.g., salary, job role, age, satisfaction) correlate most strongly with attrition.
Files in the GitHub repository-->
Project Workflow
1. Data Acquisition & Preparation: I processed a relational database consisting of multiple tables (HR Data, Job Roles, Departments, and Education).
2. Data Cleaning (Power Query): I configured and standardized appropriate data types, handled missing values for more precise segmentation.3. Data Modeling: I established a Star Schema between the fact table (HR_Data) and the dimension tables (Departments, Jobs, Education):

4. DAX Measures: I wrote custom calculations to extract Key Performance Indicators (KPIs). For example:

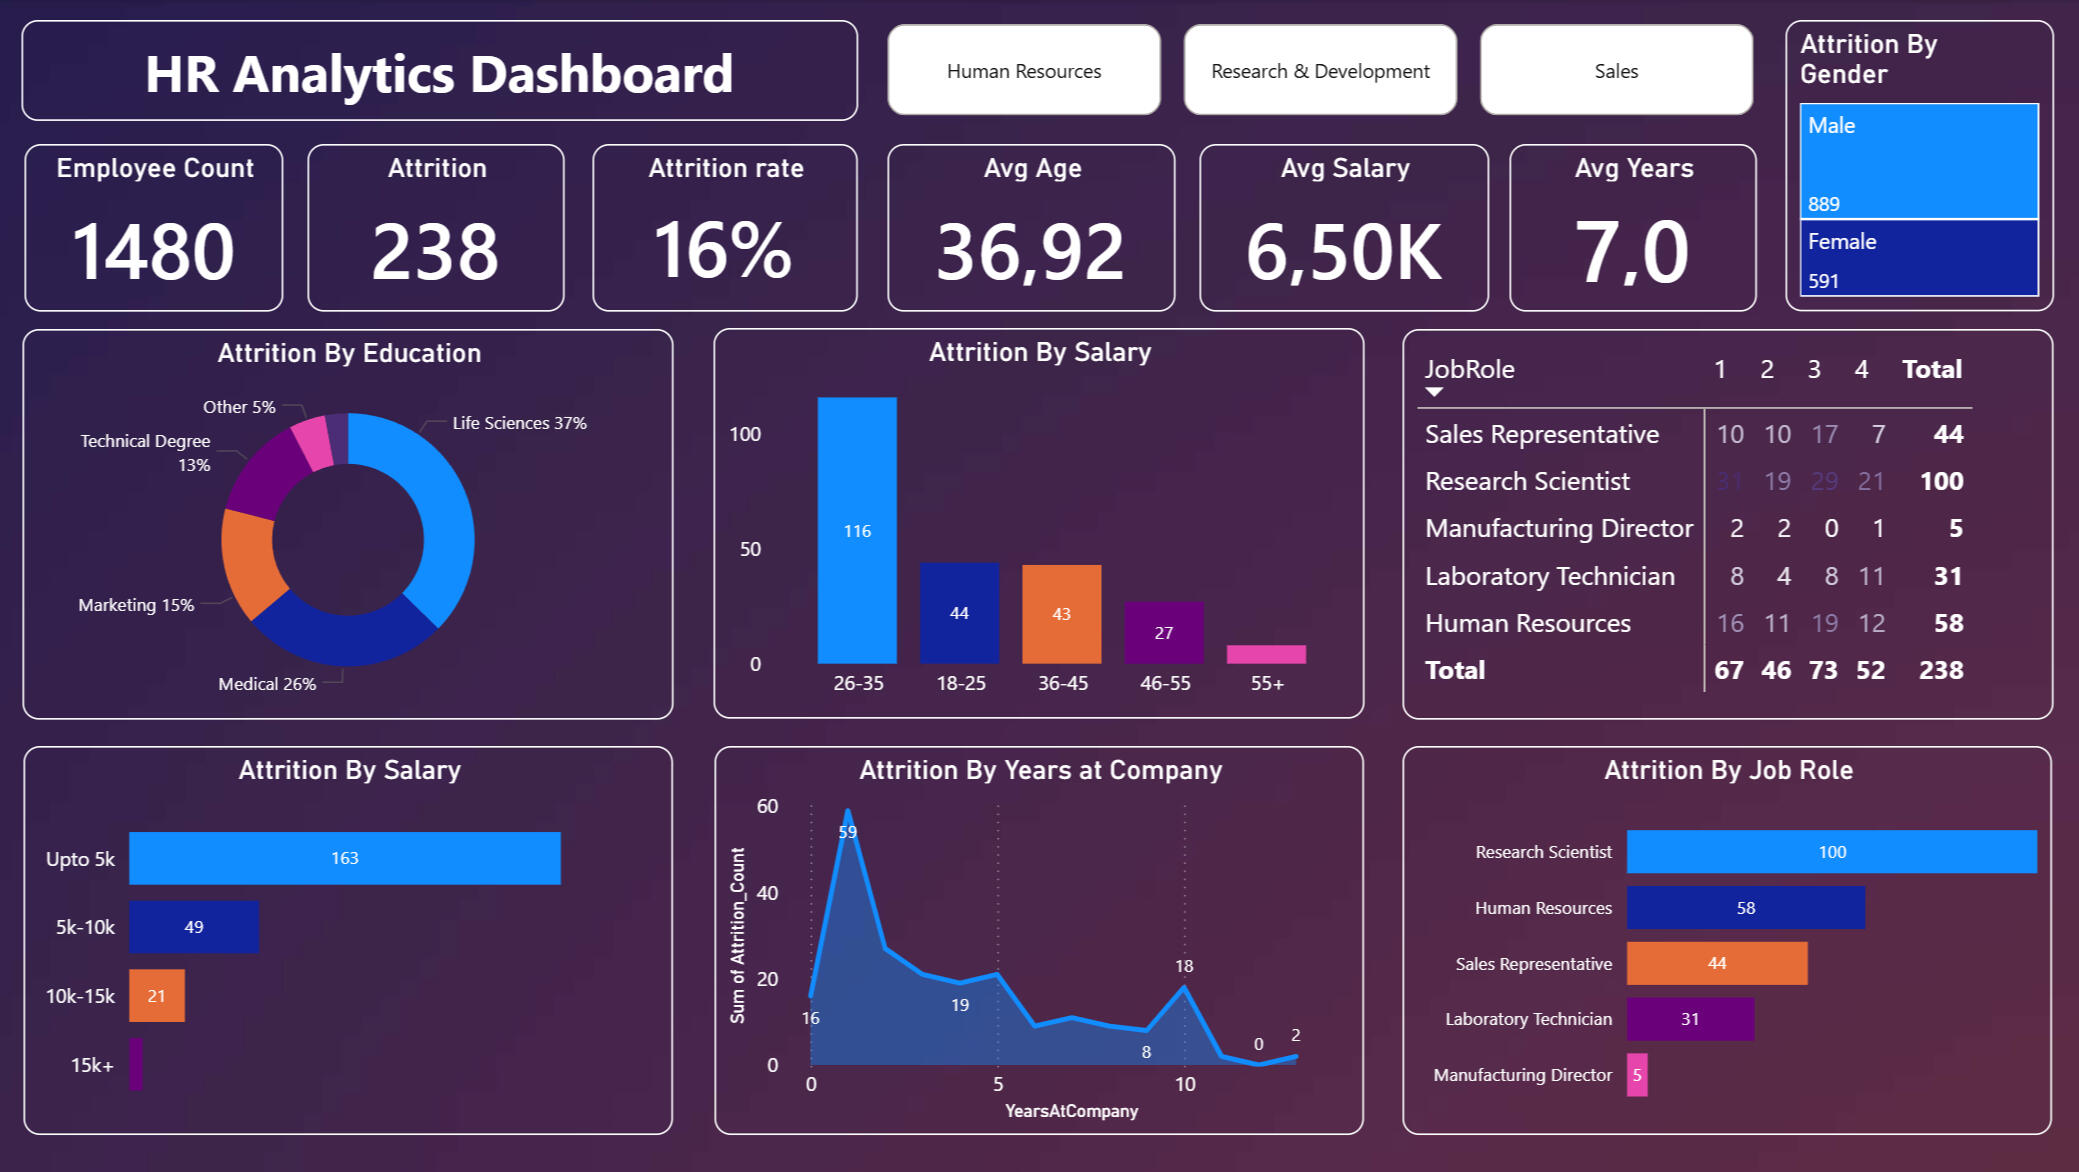
5. Visualization: I designed and implemented an interactive dashboard that visually separates demographic and professional metrics for intuitive analysis:
Business Questions Answered
Throughout my analysis, I sought and provided answers to the following questions:- What is the current employee attrition rate?
- Which age groups and genders are most prone to leaving?
- In which job roles is attrition the highest?
- How does salary level impact employee retention?
- Is there a correlation between educational background and the likelihood of resigning?
Key Findings & Insights
Based on the dashboard data, I drew the following conclusions:1. General Metrics- Total Employees: 1480
- Attrition: 238 employees (resulting in a 16.1% attrition rate).
- Average Age: 37 years.2. Demographic Trends- I observed that the 26-35 age group shows the highest turnover (116 people).
- The data indicates that the attrition rate is higher among male employees.3. Job Roles (Critical Areas)- I identified that the most critical areas for turnover are:
- Research Scientist: 100 employees
- Human Resources: 58 employees
- Sales Representative: 44 employees
- These roles require immediate attention due to their high volume of departures.
Recommendations for Management
Based on the results of my analysis, I recommend the following steps:1. Job-Specific Retention Strategy: Review the workload and career growth opportunities for Research Scientists and HR staff, as these roles show the highest attrition.
2. Retention Program for Young Talent: Implement targeted career path planning specifically for the 26-35 age group.
3. Salary Benchmarking: Conduct a market-based salary review for roles in the lowest pay brackets to ensure competitive compensation.